CSVEvery competing project in your submarket, staged each quarter.
A status table per submarket, from ground-break to topping out, read from high-resolution satellite imagery.
Spec
- GSD
- ≤0.5 m (High)
- Cadence
- Quarterly
- Platform
- High-res satellite
- Spectral
- RGB
- Formats
- CSV and GeoJSON
- Delivery unit
- One status table per submarket
- Tracks
- Ground-break to topping out
The files, quarter by quarter
- Deliverable
Quarterly status table
- Format
- What's in it
- One row per project site in your submarket. The fields are the site's location, the stage we read this quarter, the quarter it was read and the stage it was in last quarter. Join it to your own supply tracker on the project. It arrives once a quarter, ahead of your refresh.
- Cadence
- Quarterly
- Deliverable
Site layer
- Format
GeoJSON- What's in it
- The same rows as points or footprints, so the sites sit on your submarket map in ArcGIS or QGIS beside your own properties. Stage is an attribute on every feature. Quarterly, with the status table.
- Cadence
- Quarterly
- Deliverable
Stage-change history
- Format
CSV- What's in it
- For each site, the stage it was read at in every quarter we have tracked it. From the second quarter on you can see which sites moved and which sat still. Earlier reads are kept, not overwritten.
- Cadence
- Quarterly
- Deliverable
Gap flags
- Format
Flag column- What's in it
- A site we couldn't read this quarter, because of cloud or because the imagery missed it, says so in its row. It is never filled with a guess, and the previous read stays beside it.
- Cadence
- Quarterly
How it works
- 01
You send the submarket
Boundary fileA boundary as a shapefile, GeoJSON or KML, drawn the way your research team defines the submarket. If you already keep a list of competing projects, send it and we start from it. If you don't, we help you draw one up against the boundary.
- 02
We capture imagery
High-res satelliteWe pull a clear high-resolution pass over the submarket for the quarter, at 0.5 m or finer, RGB.
- 03
We read each site
Stage assessmentEach project site is staged from what is visible, set against the prior quarter's image of the same site. A stage is visible structural progress, the way you would read it standing on the road.
- 04
The table comes back
CSV and GeoJSONThe status table and the site layer, timed to your quarter-end refresh. Each later quarter extends the same table.
Limits
- Condition
Cloud over a site
- Effect
- Cloud can hide a site for the whole pass. That site's stage is read late or missed for the quarter.
- For the table
- The row is flagged, and the last read stays beside it.
- Condition
Resolution floor
- Effect
- At 0.5 m a pixel is a little under two feet across. A crane, a foundation slab, a rising frame and a finished roof show up. Interior work, façade finishes and anything a few pixels wide do not.
- For the table
- Telling a framed floor from an enclosed one is not something we promise.
- Condition
Interior fit-out
- Effect
- Imagery sees only the outside of a building from above.
- For the table
- Once a structure is enclosed, interior progress is invisible, and so is anything that happens after topping out.
- Condition
Not a schedule
- Effect
- A stage is what is visible this quarter. It says nothing about when a project will finish, and we never give a delivery date.
- For the table
- Your own delivery-date field stays yours.
- Condition
Quarterly, not continuous
- Effect
- One read per site per quarter. A project can move between two stages inside a quarter.
- For the table
- The table shows only where it stood when we looked.
- Condition
Permits and leasing
- Effect
- The table carries no permit status, ownership, leasing or pre-lease figures.
- For the table
- A project that is permitted but has no ground-break yet is not in the pipeline we read until work shows on the ground.
Why a supply table needs eyes on the site
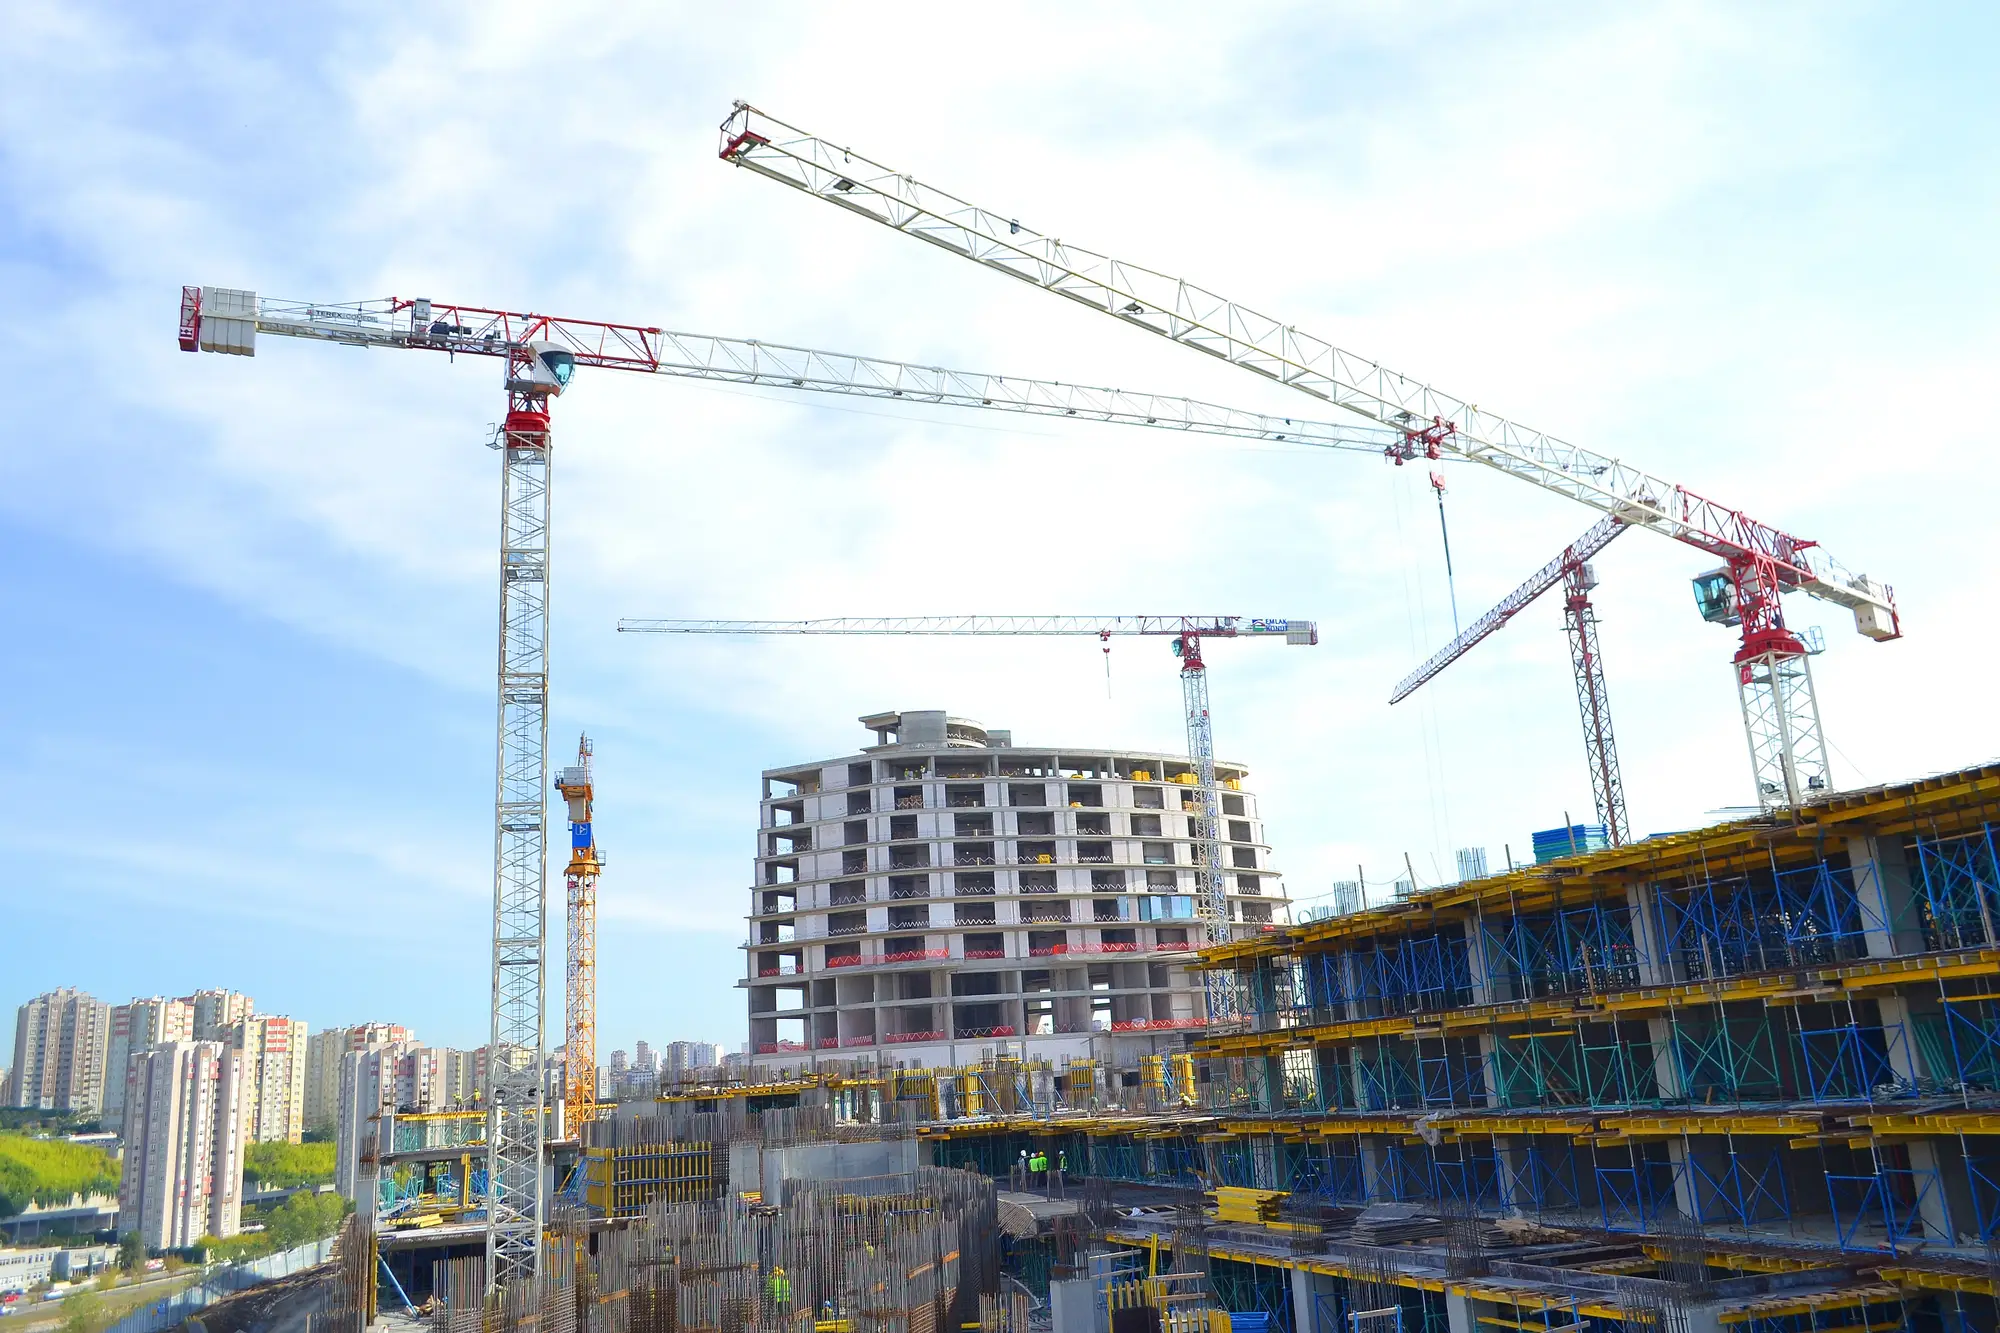
Your pipeline list comes from permit filings, vendor supply reports and announcements. Each project carries a delivery date somebody entered once, and a project stays "under construction" until a report says otherwise. Few teams can drive every site every quarter, so the supply side of your forecast leans on dates nobody has checked against the ground. A stalled site and one that topped out early look the same in the spreadsheet.
Who it's for
For
- Market research analysts at REITs who keep the competing-supply table for a submarket
- Research teams that feed the supply forecast, the quarterly market report and leasing strategy
- Teams who want a stage read on every site, next to the permit and vendor data they already use
Not for
- Predicting or confirming delivery dates
- Leasing status, pre-lease figures or ownership of a project
- Interior fit-out progress
- Tracking your own projects for draw inspections or lender reporting
Questions from the research team
Does this predict delivery dates?
No. It reports the observed stage each quarter. You keep your own delivery-date field and can check it against the stage history.
How is a stage defined?
By visible structural progress from above: site work, foundation, structure rising and topped out. It is not read from a contractor's schedule or a permit.
What do we send, and what comes back?
The submarket boundary, and a project list if you have one. You get a CSV status table and a GeoJSON site layer each quarter.
What resolution is the imagery?
0.5 m or finer, RGB. That shows foundations, cranes and a frame going up. It does not show the inside of a building.
Will it load into our supply model or GIS?
CSV and GeoJSON open in Excel, a database load, ArcGIS or QGIS. We don't write into your systems.
How do we check it against what we know?
Pick a submarket where you already know the pipeline well, send the boundary without your list, and compare our stage for each site with what you have.
Does cloud cover cause gaps?
Yes. A cloudy quarter over a site can mean a late or missing read. The row is flagged and the last stage stays beside it.
Is every submarket covered?
Coverage depends on the submarket. Send the boundary and we'll say what the imagery can see there.
Who owns the imagery and the table?
Ownership and licence terms are agreed in writing when you get started. If your counsel needs them earlier, ask.
How is it bought and priced?
Price depends on the size of the submarket and how many sites are in it. Tell us how many submarkets you track and we'll scope it from there.
Get the pipeline for your submarket.
Send us a submarket boundary. We'll tell you what the imagery can show there.
Get started